Databus Logo
Blog Login →
TutorDesk · Progress Tracking

For coaching centres & tuition institutes in India

See every student's progress — not just their last test

Track marks across every test, attendance over months and homework completion in one trend view per student. Spot who's slipping early.

Then send each parent a personalised progress report automatically — no spreadsheets, no typing, no missed updates.

Student progress tracking software for coaching centres accumulates each student's test marks, attendance and homework completion across weeks and months, and shows it as a trend view for teachers and a progress report for parents. Unlike a single test-result screen, it shows whether a student is improving, flat or declining over many tests. TutorDesk pulls the data automatically from the Assessment module and from daily attendance — no separate entry.
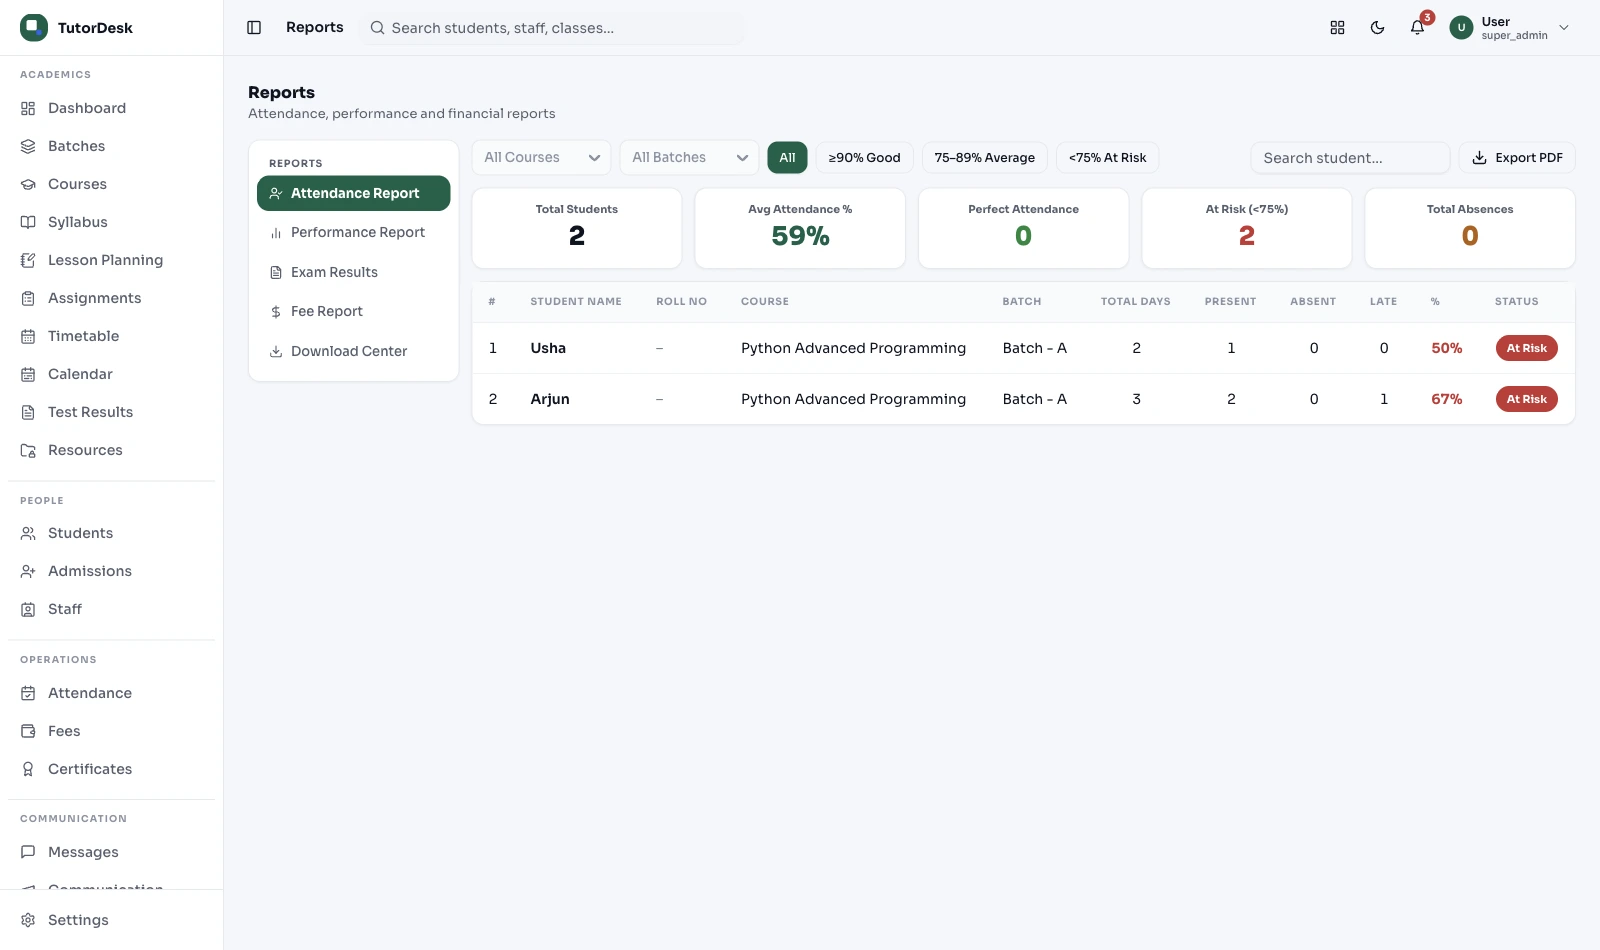
One module, three questions answered

Each role needs different answers from the same student data.

👨‍🏫
For teachers
"Which of my students is declining test to test — before the term ends?" Spot it early, without re-reading every mark.
👨‍👩‍👧
For parents
"Is my child actually improving here?" A regular progress report lands on their phone — without them having to ask.
📋
For coordinators
"Which students across all batches need attention this week?" A consolidated list, updated as marks and attendance arrive.

What is student progress tracking software for coaching centres?

Student progress tracking software accumulates each student's test marks, attendance and homework completion across weeks and months, and presents it as a trend view for teachers and a progress report for parents. Unlike a test-result screen showing one assessment at a time, it shows whether a student is improving, flat or declining over a period — using only objective academic records, pulled automatically from marks entered in Assessment and attendance marked by teachers.

How this sits among the modules: Assessment is where tests are created and marks entered — Progress Tracking accumulates those marks into a history. Analytics uses the same data for institute-level decisions (batch performance, tutor effectiveness, fee rates) — Progress Tracking uses it for individual-student decisions shared with parents. Same data, different users and outputs.

Where the progress data comes from

Zero manual entry — everything flows in from daily work.

1
Attendance marked
Daily batch attendance → each student's monthly attendance trend, automatically.
2
Marks published
Marks entered in Assessment → added to the student's marks history per subject.
3
Trends update
Trend charts and flags refresh in real time — no imports, no manual refresh.
4
Report sent
A scheduled, consent-based report goes to the parent — no manual compiling.
Feature breakdown
Four views that tell the whole student story

Everything a teacher, coordinator or parent needs — without manual assembly.

Marks history & test-to-test trend

Every mark entered joins a student's permanent history, so you see the whole arc — not just the last result — and can tell at a glance if they're climbing, plateaued or slipping since the term began.

  • Full history per subject: Physics Test 1 through 8 in one timeline, not just the latest.
  • Trend direction: up, flat or down across the last three tests — a quick flag before anyone digs deeper.
  • Subject-wise: JEE Physics tracked separately from JEE Chemistry for students in multiple batches.
  • Versus batch average: 38/50 reads very differently if the average was 42 vs 28 — so context shows.
  • Homework rate alongside: a leading indicator that often dips before marks do.
Marks trend — Arjun M. · Physics
Test history ↑ Improving
T1
T2
T3
T4
T5
T6
44/50
Last test
+18
Since T1
38.5
Batch avg

Attendance trend over time

One low month might be an exception; three declining months is a signal. Monthly and weekly attendance per student is tracked automatically from daily marking, so the difference is obvious.

  • Month-by-month: each month's percentage, not a cumulative total that hides a recent drop.
  • Below-threshold flag: dips under the percentage you set (say 75%) surface on the coordinator dashboard.
  • Subject-wise: a student might attend Physics but skip Chemistry — visible per batch.
  • Pattern spotting: repeated absences on the same weekday point to a schedule clash, not disengagement.
  • In the parent report: attendance sits next to marks, so parents see both in one place.
Attendance — Rohan K. · 2025
Monthly attendance
Jan
92%2 absent
Feb
88%3 absent
Mar
74%6 absent
Apr
61%⚠ Flagged
Declining — 3 months in a row ↓

Automated parent progress reports

Parents get a personalised report for their child on the schedule you set — weekly, fortnightly or monthly — with marks trend, attendance, homework rate and an optional teacher note. Sent as a consent-based DLT template, so nobody has to compile or type it.

  • Scheduled delivery: pick the day and frequency; TutorDesk sends it with no teacher action.
  • DLT template + app: a formatted summary on WhatsApp (registered template, to consenting parents) plus the full report in the app.
  • Personalised per student: each parent gets only their own child's report — never a batch-wide list.
  • Optional teacher comment: "Improved in Physics; focus on Thermodynamics numericals" — added from the app in under a minute.
  • Full history for parents: every past report stays in the app, not just the latest.
Progress report — April 2025
A
Arjun Mehta
JEE Batch A · April 2025
Tests this month
Physics Test 644/50 ↑
Chemistry Test 431/50 →
Attendance & homework
Attendance91%
Homework submitted7 of 10
"Improved in Physics. Chemistry numericals need attention before the term test."
💬 Sent via DLT template + app

At-risk flags — a prompt for a human, not a verdict

TutorDesk watches three objective signals per student — marks trend across tests, attendance vs your threshold, and homework rate — and surfaces students who cross them, with the reason. It's there so a coordinator notices early; it is not a judgement of the student's ability, effort or mental state, and the decision to act stays with a person.

  • Reason shown, not a label: "declining marks" reads differently from "low attendance" — you see which, not a generic tag.
  • One coordinator screen: all surfaced students across batches, ordered by how many signals tripped.
  • Early, not late: triggers after 3 missed homeworks or 2 declining tests — in time to help before the term test.
  • Action logging: note the call you made or the session you arranged, so nothing falls through between teachers.
  • Individual, not institute-wide: for batch-level patterns across the whole centre, that's Analytics.
Surfaced for review — this week
Students to review 4 this week
Priya Sharma
Marks down 3 tests · attendance 61% · 5 HW missed
View →
Vikram S.
Attendance 58% · no test taken in 2 weeks
View →
Sneha Pillai
Marks flat 4 tests · Chemistry declining
View →
Rahul M.
6 homework submissions missed in a row
View →

Progress Tracking vs. posting results on WhatsApp

Most centres drop a result list in the class group after each test. Here's what that misses.

CapabilityTutorDesk Progress TrackingWhatsApp Result Posts
Marks historyAll tests in one trend per studentSeparate messages parents scroll back for
Trend detectionAutomatic up / flat / downParent compares messages by hand
AttendanceIn the same report as marksSeparate alert, or not sent
PrivacyEach parent sees only their childWhole batch sees everyone's scores
SchedulingAutomatic weekly / monthlyManual — typed and sent each time
At-risk surfacingFrom marks + attendance + homeworkTeacher must notice by hand

Every centre that posts results on WhatsApp needs this

Individual tracking is what separates a centre parents trust from one they leave after a term.

🎯

JEE & NEET institutes

High fees, high expectations. Weekly reports showing trends in Physics, Chemistry and Maths build the trust that drives re-enrolment.

📚

School subject tuition

Parents of Class 8–12 students want to know it's working before the board exam — monthly trend reports answer that early.

🏗️

Multi-branch chains

Each branch's coordinator sees their own students to review; the owner sees the counts per branch without manual compiling.

🌐

Online & hybrid coaching

For parents who can't visit, the report is their only window in — automated delivery means nobody is left uninformed.

📈

Long courses (1–2 years)

A student slipping at six months can be supported then — not discovered at the month-18 mock.

👤

Solo tutors

20–30 students each get a monthly update with no typing — every parent feels individually looked after.

"I used to find out a student was struggling only when they bombed the mock. Now the trend shows it after the second test, the report reaches the parent the same week, and we step in while there's still a whole term to fix it."
Sunita Patnaik Academic Coordinator, NEET coaching · Bhubaneswar, Odisha

What this module does

Progress Tracking turns scattered marks and attendance into one readable story per student, over time — so a teacher sees a trend instead of a single number, a coordinator sees who to check on, and a parent sees whether the coaching is working.

Fair to the student

It works only with objective academic records — marks, attendance and homework completion. It does not build psychometric or learning-style profiles and it does not infer attention or mental state. The at-risk flag is a prompt for a human to look and help, with the reason shown and the decision left to a person — not an automated verdict on the child.

Reports, done right

Parent reports go out as DLT-registered transactional templates to parents who've consented, in line with India's TRAI rules — scheduled and personalised, never unregistered bulk messages. Each parent sees only their own child's data.

Progress Tracking ≠ Assessment ≠ Analytics ≠ Student CRM

These sit close together, so here's the clean line:

  • Assessment creates tests and captures marks. Those marks feed Progress Tracking.
  • Analytics answers institute-level questions — batches, tutors, fee rates.
  • Student CRM holds the student record the progress history attaches to.
  • Progress Tracking owns one thing: the individual student's trend over time, and the parent report.

Frequently asked questions

What teachers and owners ask about progress tracking.

What is student progress tracking software for coaching centres?
A module that accumulates each student's test marks, attendance and homework completion over weeks and months, shown as a trend for teachers and a report for parents. Unlike a single result screen, it shows whether a student is improving, flat or declining — using data pulled automatically from Assessment and daily attendance, with no separate entry.
How is Progress Tracking different from Analytics?
Analytics is for institute-level decisions — batch performance, tutor retention, fee rates — used by owners. Progress Tracking is for individual-student decisions — is this student improving, should we step in — used by coordinators and shared with parents. Same data, different users and questions.
Can it send progress reports to parents automatically?
Yes — on a schedule you set (weekly, fortnightly, monthly), as consent-based DLT-registered templates over WhatsApp plus the full report in the app. Each is personalised with marks trend, attendance and an optional teacher comment, with no manual typing.
What does a progress report include?
Marks per test over the period with trend direction, attendance percentage and any pattern, homework submission rate, a subject-wise breakdown for multi-batch students, a comparison to the batch average, and an optional teacher comment.
Does it show subject-wise performance per student?
Yes. For a student in multiple subject batches, the report shows each subject separately — marks trend in Physics, attendance in Chemistry, and so on, in one place.
How does it flag students falling behind — and is that fair?
From three objective signals — declining marks, attendance below your threshold, low homework. The flag surfaces a student for a coordinator to review and shows the reason; it isn't a judgement of ability, effort or mental state, and the decision to act stays with a person. For institute-wide patterns, see Analytics.
Where does the data come from — do I enter it separately?
No. Marks feed from Assessment on publish, attendance from daily marking, and homework from the homework module. Progress Tracking just aggregates and presents the history.
Can parents see the full history in the app?
Yes — every report ever generated for their child: full marks history, attendance trends and teacher comments since enrolment, not just the latest.
Is the at-risk flag shown to the student?
No — it's an internal coordinator tool, not a label on the student. It exists so a human can notice early and offer support, and coordinators log the action they take so nothing falls through.
Does it profile a student's learning style or behaviour?
No. It uses only objective academic records — marks, attendance and homework. It builds no psychometric, learning-style or behavioural profiles and infers nothing about attention or mental state.

Show every parent their child is moving forward.

Automatic reports every week, every student, zero manual effort — and trouble spotted early enough to fix.

Book a free demo